Using sngrep
There are several tools to monitor network traffic, such as tcpdump on Linux or wireshark on Windows, here instead we are going to install sngrep, a very useful tool for analyzing SIP traffic. The main feature of sngrep is the ability to graphically display the complete flow of a SIP call even over an SSH session.
Setup
The installation is quite simple and can be done starting from the clone of the git repository:
	yum install ncurses-devel make libpcap-devel pcre-devel openssl-devel gcc autoconf automake git
	git clone https://github.com/irontec/sngrep

	./bootstrap.sh
	./configure --with-openssl

	make
	make install
The sngrep executable can be found in the src subfolder of the main path where you extracted the repository.
Alternatively it is possible to directly download the rpm from the repository https://packages.irontec.com/ and install it.
Monitoring of the SIP traffic
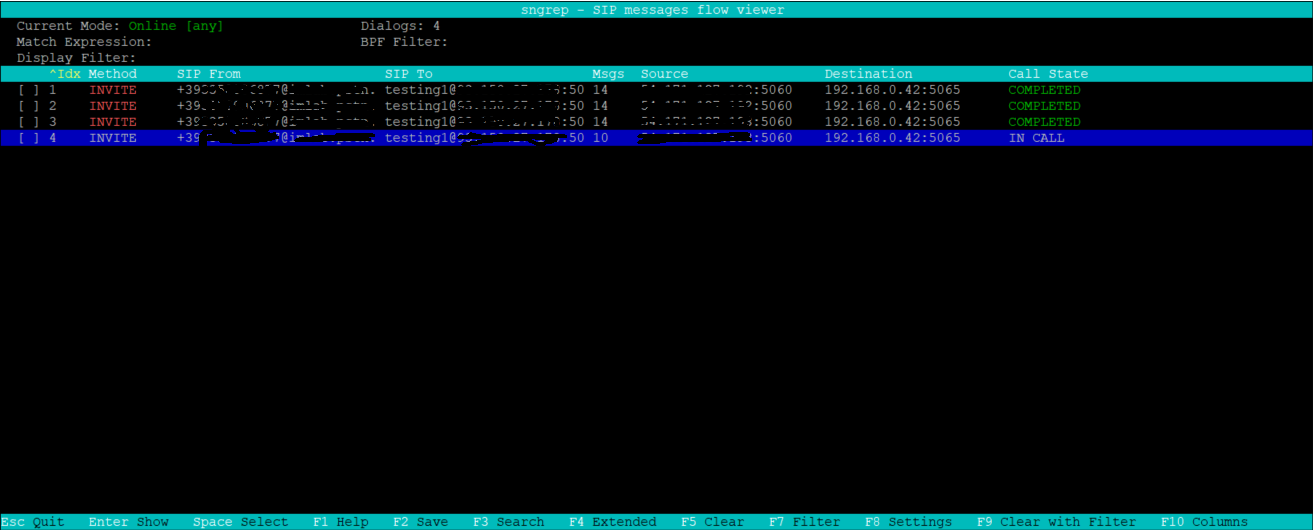
Once installed we can start it by simply running the * sngrep * command and, if present, the SIP traffic will begin to appear on the graphical interface.

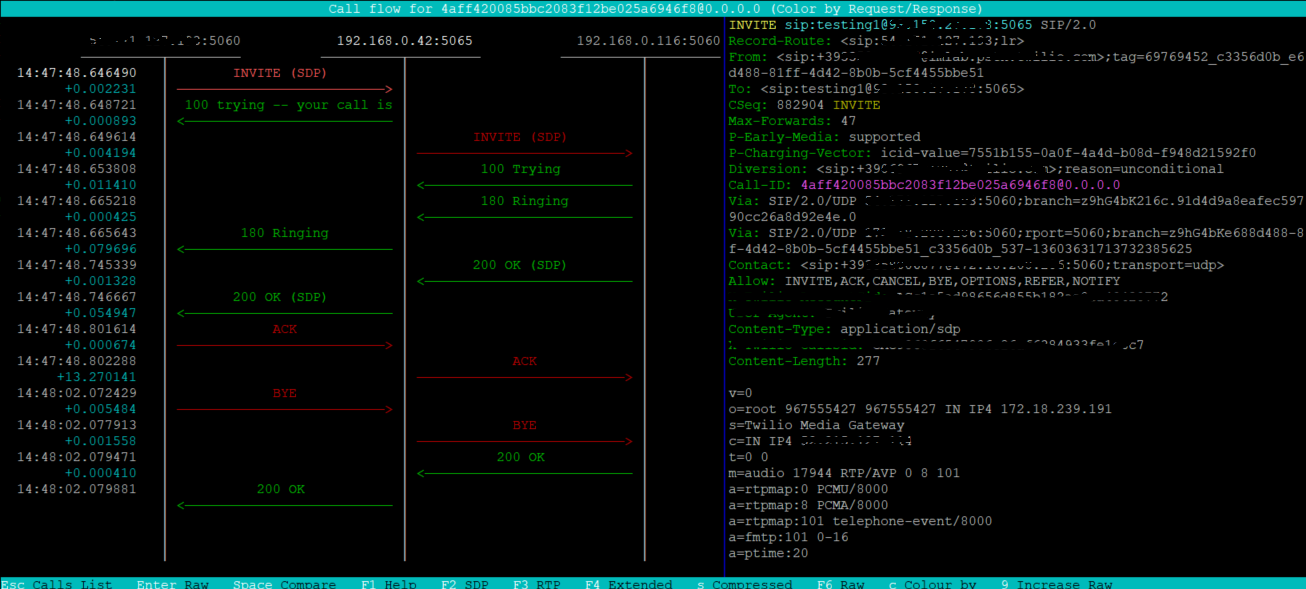
Using the UP/DOWN arrows it is possible to select a specific transaction and by pressing ENTER view the entire SIP Request/Response flow.

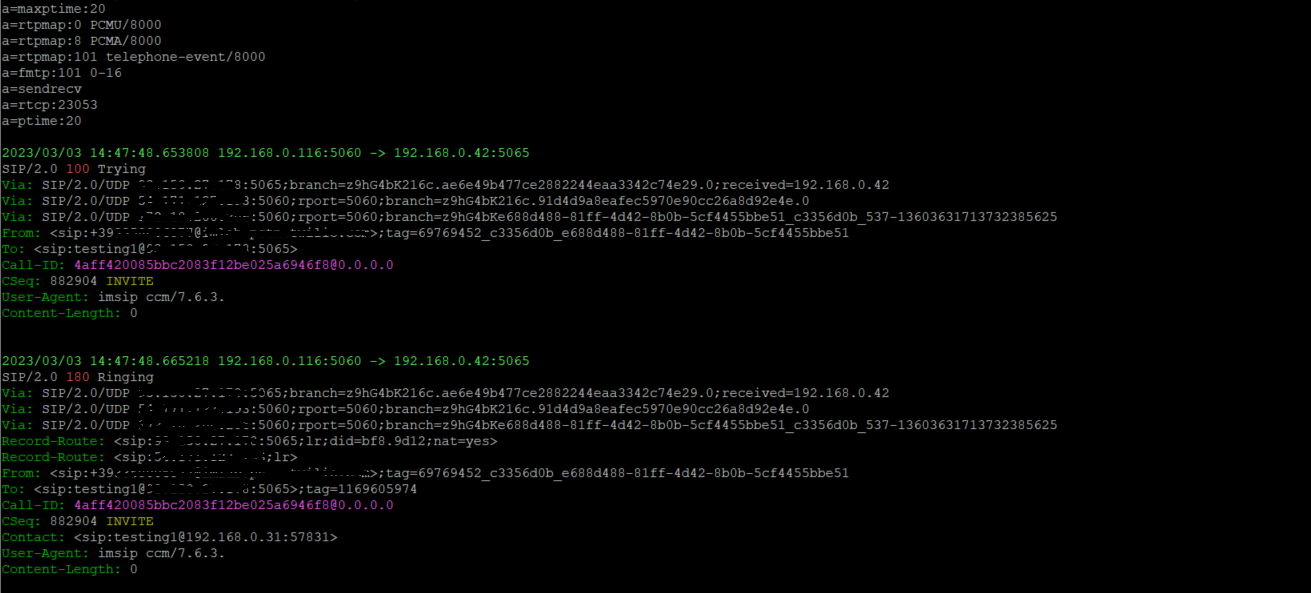
The bar at the bottom of the graphical interface shows a series of options that can be used to change the display, for example by pressing F6 you can switch to displaying the raw messages.
